Visual Studio Projects that Just Keep Rebuilding, or: How Quantum Mechanics Mess Up Your Build

A lot has already been said on it, (no, seriously, a lot) and yet some root causes are not yet covered. All that follows holds for C++ projects, C#, VB, and everything MSBuild in general.

The symptom

Normally if you build your solution, change nothing and immediately try to build again – nothing happens, as you’d expect. But occasionally some projects are rebuilt despite not being modified. If by bad luck these projects are high up the dependency tree – many other projects are re-built, and irks galore abound.

First step: diagnose

Set MSBuild’s build verbosity to ‘diagnostic’, under Tools / Options / Projects and solutions / Build and Run:

Then build. The first lines of the output should hold the reason that VS thinks the project is out of date. Typical stated reasons are –

—— Up-To-Date check: Project: Whateva, Configuration: Release Win32 ——
Project not up to date because build input ‘F:\sources\Shiny.h’ is missing.

Project ‘Whateva’ is not up to date. Project item ‘Shiny.html’ has ‘Copy to Output Directory’ attribute set to ‘Copy always’.

Project ‘Whateva’ is not up to date. CopyLocal reference source ‘F:\folder1\blah.dll’ is more recent than ‘F:\folder2\blah.dll’.

Project ‘Whateva’ is not up to date. Input file ‘F:\sources\yadda.csproj’ is modified after output file ‘F:\bin\yadda.pdb’.

Project ‘Whateva’ is not up to date. Last build was with unsaved files.

In my personal experience the most common reason is the first one: a file that is included in a project but is missing on disk. Treating this state as out-of-date is a weird design decision (I’d say VS should refuse to build), but that’s just the way it is. Anyway, more can – and should – be said about file dates.

File Dates: More than meets the eye

Oddly, sometime MSBuild’s claim that file1 is newer than file2 persists after a build re-copies file1 over file2. Sometimes manually copying file1 over file2 helps, and sometimes not.

The question whether file1 is newer than file2 is not as straightforward as it might seem. NTFS has two associated times: created time and modified time (never mind ‘last access time’ now). The full rules of how these dates react to a copy/move are somewhat involved but the key piece in this context is:

If you copy a file from D:\NTFS to D:\NTFS\SUB, it keeps the same modified date and time but changes the created date and time to the current date and time. [In particular, making the created date later than the modified date]

So the date that is preserved across copies is modified date – but MSBuild compares created dates to determine whether a file should be copied. I sincerely wish it wouldn’t – but wait, the creation date in the copy can only grow newer than the source, and this shouldn’t call for a re-copy anyway, should it?

Enter NTFS Tunneling.

This Windows feature is beyond esoteric, so don’t feel bad if it doesn’t ring any bell. In a nutshell:

When a name is removed from a directory (rename or delete), its short/long name pair and creation time are saved in a cache, keyed by the name that was removed. When a name is added to a directory (rename or create), the cache is searched to see if there is information to restore. The cache is effective per instance of a directory. If a directory is deleted, the cache for it is removed.

Simply put, when you copy a file to a location where it previously existed, its original created date is resurrected – regardless of the created date of the actual source file.

<Sigh/>.

The name ‘tunneling’ derives from a quantum mechanics phenomena (hence the clickbait post title) where particles emerge in seemingly impossible locations. The original motivation for this design is irrelevant for decades now (probably since MS-DOS), and it is most probably left around as a compatibility constraint. Even better, on my own computer it seems the lifetime of the cache (advertised to be 15 seconds) is really infinite, and modifying it via the MaximumTunnelEntryAgeInSeconds registry key isn’t working.

<Double sigh/>.

Solutions

You can shut down tunneling altogether by setting HKLM\SYSTEM\CurrentControlSet\Control\FileSystem\MaximumTunnelEntries to 0, as shown in the KB article.

If for whatever reason you prefer not to mess with arcane NTFS registry keys, you can do the following: rename your bin folder (the one holding the created-date cache) to a temporary name, create a new bin folder and copy the previous bin contents to it. This seemingly no-op clears the tunneling cache and in my experience rids of the last bogus out-of-date checks.

These redundant re-builds are pretty much gone for me now. Please do tell me in the comments if it worked for you – and more importantly, if it didn’t.

Advertisement
Posted in Uncategorized | 7 Comments

How to Make a Phone Book Build and Run

Here’s a short cheat sheet summarizing an internal talk I gave a while ago about VC++ build diagnostics. These switches and tools are all documented, most are surveyed in previous posts here, and all are very useful when struck by baffling build/load errors.

Stage Diagnostic Tool
Solution / project configuration Tools/ Options/ Projects and Solutions/ Build and Run/ MSBuild output verbosity – Diagnostic
Includes Project Properties/ configuration /C-C++/ Advanced/Show Includes – Yes
Preprocessor Project Properties/ configuration /C-C++/ Preprocess to a File – Yes
Compiler output, obj or lib VS command prompt – “Dumpbin /ALL YourBin.lib > YourOutput.txt”
optionally undname on relevant names in the result
Linkage Project Properties/configuration/Linker/Show Progress – VERBOSE
Complete binary Dependency Walker
Loader Gflags / ShowSnaps
When in doubt Process Monitor

To use this effectively you must first define the exact stage where the failure occurs (which isn’t always trivial), then use the listed switch/tool.

Specifically Process Monitor is useful in multiple contexts – but mostly when you suspect used file is being consumed from an erroneous location. I recommend not adding a process name filter, as multiple processes are typically involved – devenv.exe, MSBuild.exe, cl.exe, link.exe, mspdbsvr etc. For header files there’s /ShowIncludes and for dll’s there’s link /verbose or Gflags/ShowSnaps, but many other files are consumed and have potential for errors (property sheets, resources, etc.) and ProcessMonitor covers them all.

Enjoy.

Posted in Visual Studio | Leave a comment

An equivalent project (a project with the same global properties and tools version) is already present

Quick note: when you get this error while trying to add a VC project to your solution, good chance your project is missing a .filters file.

Googling taught me only that the same error message had a different reason a while ago, so this qualifies as deserving more web presence.

Posted in VC++, Visual Studio | Leave a comment

Tinkering with VS2015 (CTP 6)

Today I downloaded the latest VS bits and played around with the native debugger. It was a brief session and so would be the records of my impressions.

J Universal CRT is here!

And seems like a great idea.

A lot of cheese was moved around in the process, and it would probably take me a while to know my way around again. As a prominent example, dbgint.h is now replaced by debug_heap.cpp – which is a borderline-breaking change: dbgint.h was kind-of-documented (although wrapped in disclaimers and admittedly an internal implementation detail), and real code came tumbling down. What’s worse, the type declarations that were available in dbgint.h are now hidden in debug_heap.cpp – which includes many un-published internal headers – and tool writers would probably have no choice but to cut and paste the type declarations and hope for the best.

I’m not entirely sure this breaking change (and others like it) are by design. One can still hope the final bits would see this fixed. What’s much worse –

L Published MS symbols are all stripped

Which means you can’t step through CRT/MFC sources. This is a major setback in productivity, and I hope only a temporary one.

J Context operator replaced

The context operator (‘{,,dll}symbol’) while being mighty useful at debug time, was broken beyond repair – and as I hoped in 2009 is replaced by the windbg-like ‘!’ operator:

However, as apparent in the screenshot:

L Context operator no longer deduces type

… and explicit casts are in order where they previously weren’t. That might seem like a quibble but this in fact prevents some very useful hacks previously available, notably checking memory integrity from the debugger:

The closest I currently have to a workaround is to capture the function to a variable in code, and invoke it from the watch window:

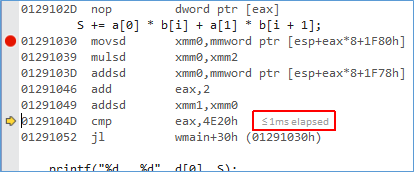
J Micro Profiling!

After you step past a code line in the debugger, a neat little tooltip appears:

Even in disassembly!

J Wide-register watch

‘xmm0il’ now works in x64 also.

BTW, the default platform is now ‘x86’ and ‘Win32’ is addable as a separate configuration from the config manager. Not sure why and what is the difference.

L Auto-vectorization

It seems little progress was made in auto vectorization – AFAICT all previous reports still hold.

Posted in Debugging, VC++ | Leave a comment

Accelerating Debug Runs, Part 2: _ITERATOR_DEBUG_LEVEL

A previous post discussed the Windows Debug Heap – with the main motivation being how to avoid it, as it is just empty, expensive overhead, and it isn’t clear why it is on by default in the first place. Remarkably, 3 weeks after posting here the VC team announced that from VC “14” (now in CTP) onwards the WDH will be opt-in and not opt-out, as it should be. So hopefully in ~2 years the recommendations in the last post will be largely obsolete. Anyway, I’m often facing unworkably slow run times in debug even after disabling the WDH, and further measures are in order.

In debug builds the VC++ CRT implementation runs a hefty load of iterator-validation tests on all STL containers – the simplest example being raising an assertion when an std::vector subscript is out of range. This leads to the unfortunate reality wherein if someone writes C++ code ‘by the book’, using standard containers for everything, s/he often ends up writing code that is utterly unusable in debug.  In one of our projects image classes were coded with std::vector as the container for the image bits. The product code is very intensive in iteration on pixels of many images, and as a result debug builds completed a typical job in ~4 hours, whereas a release build completed in ~4 minutes. For a long while debugging that project was reduced to logging and stepping in disassembly, as debug builds were completely useless.

Now for some good news and some bad news. The good news is that this behavior is customizable via the _ITERATOR_DEBUGGING_LEVEL macro: #define it to 0 (or 1, if you have a particular need for it) early in the compilation – say in the project properties or the top of a precompiled header– and this disproportional computational overhead is gone.

The bad news is that this doesn’t work.

MSVCMRTD.lib(locale0_implib.obj) : error LNK2022: metadata operation failed (8013118D) : Inconsistent layout information in duplicated types (std.basic_string<char,std::char_traits<char>,std::allocator<char> >): (0x0200004e).

Well that was a tad dramatic – it doesn’t always work, and in /clr builds in particular.

<rant>Now /clr projects will probably forever be second class citizens in the VC universe. Features will forever be coded for mainstream native code and will trickle down to /clr code as time and priorities permit (two notable examples are data breakpoints and debugger visualizers that are still unsupported in mixed debugging, but trust me – there are plenty more). </rant> Anyhow, as far as _ITERATOR_DEBUG_LEVEL goes – this is much more a bug than something resembling a decision. The venerable Stephan T. Lavavej elaborates (3rd reply from the bottom):

…The underlying problem is that _ITERATOR_DEBUG_LEVEL affects the representations of STL containers, and C++ (both native and especially managed) really hates it when code can’t agree on the representation of an object.  When _SECURE_SCL/_HAS_ITERATOR_DEBUGGING were added in VC8, we should have created 5 variants of the CRT/STL binaries (including DLLs).  Unfortunately we didn’t (this was before my time, otherwise I would have spoken up), and having only debug and release DLLs causes headaches.  We suffered from longstanding problems in VC8/9 until we overhauled how this worked in VC10.  During VC10 we untangled the worst of the problems by making std::string header-only.  With invasive surgery we were able to get native code working correctly in every case except one very obscure one that nobody has noticed or complained about yet.  (We now have 5 static libs, which solves the case of static linking absolutely 100% perfectly, but still only 2 DLLs.)  But managed code is structured differently, and the tricks that work in native don’t work for it.  As a result, customizing _ITERATOR_DEBUG_LEVEL basically doesn’t work under /clr[:pure].  Very few customers have encountered this (you’re one of the first) because we changed the release mode default to IDL=0 (which everyone wants), and few people want to modify debug mode’s default of IDL=2.

The thread is from Jan 2011 and this particular issue was resolved in VS2013. Similar issues remain, and I’m not sure /clr code would ever make it into routine test matrices in MS – so as the CRT code evolves, these issues would probably keep popping.

Bottom line: if – like me – you’re debugging C++ code that is both managed and makes extensive use of STL – your mileage may seriously vary when trying to customize iterator debug level. If you do develop purely native code and are trying to accelerate debug runs, I do recommend judiciously setting _ITERATOR_DEBUG_LEVEL to zero – and raising it back only when you’re tracking concrete iterator issues.

In the same reply Stephan offers an alternative:

Have you considered making your “debug build” compile in release mode with no optimizations?  Release mode versus debug mode affects what CRT/STL/etc. you link to (and whether you can effectively debug into them) and as a side effect affects your IDL default, but it’s not inherently tied to whether your own code is compiled with optimizations or not, and that’s what affects the debuggability of your own code.  The IDE pairs release mode with optimizations and debug mode without optimizations, but there’s no fundamental reason linking the two.

This makes sense and I briefly experimented with this approach. Sorry to report, still no success. While I still can’t pinpoint the root cause, even when compiling release builds with /Od (optimizations disabled) the debugging experience is severely crippled. (and yes, of course I raised the proper PDB generation switches in both the compiler and the linker). Local variable watch and single-steps seemed highly erratic, ‘this’ pointer for class methods seemed to stick with $rcx throughout the method and thus give rubbish on member watch – etc. etc.

However, this is a step in a better direction. More on that in the next post.

Posted in Debugging, VC++ | 1 Comment

Accelerating Debug Runs, Part 1: _NO_DEBUG_HEAP

(A more appropriate but even-less-catchy title might have been ‘accelerating runs from the debugger‘. As elaborated below, these two are not strictly equal).

A common notion is that debug builds can and should carry as much debugging overhead as one can possibly scram in – after all, the point in debug builds is exactly this, debug, and you should never care about their performance. After too many cases of slow-to-the-extent-of-utterly-unworkable builds, I respectfully disagree. In this and the next post, a few techniques to make debug builds run faster are laid out.

Introducing the Windows Debug Heap

As many, many, have already discovered – the WDH is a big deal as far as performance goes, and yet MSDN is unusually terse about it. The HeapSetInformation page says:

When a process is run under any debugger, certain heap debug options are automatically enabled for all heaps in the process. These heap debug options prevent the use of the LFH. To enable the low-fragmentation heap when running under a debugger, set the _NO_DEBUG_HEAP environment variable to 1.

And in some arcane corner of the WinDBG documentation:

Processes that the debugger creates (also known as spawned processes) behave slightly differently than processes that the debugger does not create.

Instead of using the standard heap API, processes that the debugger creates use a special debug heap. You can force a spawned process to use the standard heap instead of the debug heap by using the _NO_DEBUG_HEAP environment variable or the -hd command-line option.

(While the latter was written for windbg, everything except the –hd switch holds equally for VS).

What are these ‘certain heap debug options’? What is the price in performance? Can the WDH be avoided altogether? Stay tuned.

Creating and Avoiding the WDH

The debugger itself calls IDebugClient5::CreateProcess2 which creates a debuggee process with WDH by default. The WDH creation can be bypassed by specifying DEBUG_CREATE_PROCESS_NO_DEBUG_HEAP in the options argument, and the MS debuggers do exactly that when the aforementioned environment variable _NO_DEBUG_HEAP exists and is set to 1.

( I suspect the underlying appartus is that CreateProcess with the DEBUG_PROCESS flag causes windows to check the environment variable _NO_DEBUG_HEAP and decide which process heaps to create, but I didn’t verify).

You can set this environment variable either globally for the machine (as I do) or in a specific debug session via the project properties:

What the WDH Does

  1. The only documented effect is disabling the LFH – which makes sense, as these are mutually exclusive heap layouts. You do lose some speedups by dropping the LFH but by and large this is a negligible factor compared to the others.

2. On every allocation the memory manager initializes every allocated DWORD to 0xbaadfood, and on every deallocation sets the memory to 0xfeeefeee – in addition to some bookkeeping just after the allocated chunk. Here’s the normal view:

And here’s the view with _NO_DEBUG_HEAP=1:

These magic numbers can help in some debugging scenarios – use of uninitialized heap memory, and usage after free – but truth be told, they rarely do. Here are some more details. Most of the extra time, however, is not spent there.

3. On every memory operation, the WDH walks the heap and checks for integrity! To observe, add some corruption:

And run:

Now run again with _NO_DEBUG_HEAP set to 1 – and watch the assertion vanish.

Err, this stuff actually sounds useful. Sure I should disable it?

For regular C++ applications – beyond a doubt, yes.

the CRT delivers identical functionality, on top of the windows debug heap, with different magic numbers: 0xcdcdcdcd for fresh allocations and 0xdddddddd for freed memory. If you leave the WDH on you’re initializing memory chunks twice – and worse, checking heap integrity – for each allocation. In regular development scenarios WDH is just empty, very expensive overhead.

By ‘regular’ C++ programs I mean those that don’t do anything fancy with the heap and just stick to the built in CRT heap. You can overload new/delete, as long as your overloads eventually call the shipped new/debug/malloc/free, or some dbg/aligned siblings.

One potential argument in favour of leaving the WDH on is that unlike the CRT debug heap the WDH is operational in release builds also, but (1) it is disabled for any launch outside a debugger anyway, (2) in the extremely unlikely case that you’d require memory integrity checks but don’t want to run a debug build, I would suggest just editing your debug configurations to include optimizations. (add /O2).

Oh, and in our applications setting _NO_DEBUG_HEAP=1 accelerated some runs by a factor of 10. Nough said.


Edit (Oct 6 2014):

Remarkably, 3 weeks after initially publishing this post it seems the VC team themselves agree. Beginning with VS “14”, the WDH will be opt-in, not opt-out – as it ought to be.

Posted in Debugging, Visual Studio, Win32 | Leave a comment

Debugging Memory Corruption II

Some years ago I shared a trick that let’s you call _CrtCheckMemory from the debugger anywhere, without re-compilation.   The updated (as of VS2013) string to type at a watch window is:

{,,msvcr120d.dll}_CrtCheckMemory()

Let’s expand on that today, in two steps.

Checking memory on every allocation

The CRT heap accepts a neat little flag, called: _CRTDBG_CHECK_ALWAYS_DF.  Here’s how it used:

int main()
{
// Get current flag
int tmpFlag = _CrtSetDbgFlag(_CRTDBG_REPORT_FLAG);

// Turn on corruption-checking bit
tmpFlag |= _CRTDBG_CHECK_ALWAYS_DF;

// Set flag to the new value
_CrtSetDbgFlag(tmpFlag);

int* p = new int[100]; // allocate,
p[101] = 1;   // corrupt,    and…

int* q = new int[100];  // BOOM! alarm fires here

}

Testing for corruption on every allocation can tangibly slow down your program, which is why the CRT allows testing only every N allocations, N being 16, 128 or 1024.  Usage adds half a line of code – pasted from MSDN:

// Get the current bits
tmp = _CrtSetDbgFlag(_CRTDBG_REPORT_FLAG);

// Clear the upper 16 bits and OR in the desired frequency
tmp = (tmp &amp; 0x0000FFFF) | _CRTDBG_CHECK_EVERY_16_DF;

// Set the new bits
_CrtSetDbgFlag(tmp);
}

Note that testing for corruption on every memory allocation is nothing like testing on every memory write – the alarm would not fire at the exact time of the felony, but since your software allocates memory (even indirectly) very often – this will hopefully help narrow down the crime scene quickly.

Checking memory on every allocation – from the debugger

You might reasonably want to enable/disable these lavish tests at runtime.

The debug flags are stored in {,,msvcr120d}_crtDbgFlag, and the numeric value of _CRTDBG_CHECK_ALWAYS_DF is 4, so one might hope that these lines would enable and disable these intensive memory tests:

image

Alas, this doesn’t work – _CrtSetDbgFlag contains further logic that routes the input flags further to internal variables. The easiest solution is to just call it:

image

First two lines enable, last two lines disable.  If you’re running with non default flags, the actual values you’d see might be different.

Posted in Debugging, VC++ | 3 Comments

Hidden Tracepoint Keywords

The tracepoints window includes instructions for several special keywords, the most useful by far being $CALLSTACK:


These are not all there are – two more exist: $TICK and $FILEPOS. Quoting the documentation:

$TICK inserts the current CPU tick count, while $FILEPOS inserts the current file position.

$TICK displays a time counter in hex, but otherwise both work as advertised and are documented and official. There is just a good chance nobody knows them, since –reasonably – no one thought of going on MSDN to dig them out, as the dialog itself goes unusually deep into details.

Posted in Visual Studio | Leave a comment

Debugging Handle Leaks

This is all well documented stuff and I won’t go into details – it’s here mostly for self reference (3rd time I had to chase this down in google).

Steps are:

(1) Install WDK to integrate the WinDbg engine with VS (not strictly necessary, but very convenient).

(2) Attach to the debugee via ‘User Mode’ transport:

image

(3) Continue execution, and break at the spot where the handle count is at ‘reference’ value.

(4) At the ‘Debugger Immediate Window’ type ‘!htrace –enable’

(5) Continue execution and break at a point where the handle count is supposed to be at reference value but isn’t.

(6) At the ‘Debugger Immediate Window’ type ‘!htrace –diff’.


The offending stack[s] should be visible at the debugger immediate window.  If you get garbage, there’s a good chance you’re debugging a 32bit process on a 64bit machine.

Posted in Debugging, Visual Studio, Win32 | Leave a comment

UseDebugLibraries and Wrong Defaults for VC++ Project Properties

Many of the projects I’m working on seem to have wrong default properties in Debug configuration.  For example, ‘Runtime Library’ is explicitly set to /MDd but defaults to /MD. ‘Basic Runtime Checks’ is explicitly set to /RTC1 but defaults to  none. ‘Optimization’ is explicitly set to /Od but defaults to /O2, and so on:

image

image

This recently caused us some trouble, and the investigation results are dumped below.

The direct reason is that these vcxproj’s are missing the ‘UseDebugLibraries’ element, under the ‘Configuration’ PropertyGroup: it should be set to true in Debug and false in Release.   A correct vcxproj should include some elements like –

<PropertyGroup Condition="'$(Configuration)|$(Platform)'=='Debug|Win32'" Label="Configuration">
    <ConfigurationType>StaticLibrary</ConfigurationType>
    <UseDebugLibraries>true</UseDebugLibraries>
    <PlatformToolset>v120</PlatformToolset>
    <CharacterSet>Unicode</CharacterSet>
</PropertyGroup>
<PropertyGroup Condition="'$(Configuration)|$(Platform)'=='Release|Win32'" Label="Configuration">
    <ConfigurationType>StaticLibrary</ConfigurationType>
    <UseDebugLibraries>false</UseDebugLibraries>
    <PlatformToolset>v120</PlatformToolset>
    <CharacterSet>Unicode</CharacterSet>
</PropertyGroup>

Most ‘Configuration’ sub-elements (CharacterSet, ConfigurationType etc.) directly control import of custom property sheets, but UseDebugLibraries doesn’t. Instead, it is expected in various hooks around regular property sheets. For example, Microsoft.Cpp.mfcDynamic.props includes the following –

<ClCompile>
<RuntimeLibrary Condition="'$(UseDebugLibraries)' != 'true'">MultiThreadedDll</RuntimeLibrary>
<RuntimeLibrary Condition="'$(UseDebugLibraries)' == 'true'">MultiThreadedDebugDll</RuntimeLibrary>
</ClCompile>

Why UseDebugLibraries was missing from some libraries and present in others remained a mystery until I noticed that the younger libraries tended to have this element. Indeed, the real culprit is the migration from VS2008- (vcproj format) to VS2010+ (vcxproj/MSBuild format).  MS’s migration code just did not add this element. The generated projects are functional – they just explicitly set every individual compilation switch affected by UseDebugLibraries, which makes it overly verbose and a bit sensitive – especially in the presence of junior devs who tend to stick to defaults…

So every library you have which is 4Y+ old is susceptible to this migration bug, and I suggest you manually add UseDebugLibraries.  If you have a central prop sheet where you can control multiple projects – add it there.

Not much point in reporting this to MS, is there? The chances of a fix are practically zero, and the issue would get equal web-presence here.

Posted in MSBuild, VC++ | 5 Comments