C++ Const Constructability

[Inspired by CppQuiz #264]

Take this code snippet:

struct C { int i; };
const C c;
...

It fails to compile in gcc, with:

error: ‘const struct C’ has no user-provided default constructor and the implicitly-defined constructor does not initialize ‘int C::i’

Clang and icc give similar error messages. MSVC does agree to compile it, but somewhat reluctantly:

warning C4269: ‘c’: ‘const’ automatic data initialized with compiler generated default constructor produces unreliable results

If you remove the const qualifier, everything builds fine. What’s the deal?

Rationale

An uninitialized object that is also constant would not be able to be populated with meaningful values later – and so is a strong indication of a coding error. The C++ standard made an exception to its’ usual philosophy and tried to stop this particular bullet from hitting your foot:

If a program calls for the default-initialization of an object of a const-qualified type TT shall be a const-default-constructible class type or array thereof.

A class type T is const-default-constructible if default-initialization of T would invoke a user-provided constructor of T (not inherited from a base class) or if

  • each direct non-variant non-static data member M of T has a default member initializer or, if M is of class type X (or array thereof), X is const-default-constructible,

  • if T is a union …,

  • if T is not a union …,

Limitations

1. First and most obvious, the compiler does not try to check whether the user provided ctor actually does everything it should, or anything at all. This builds fine:

struct C {
 C() {};
 int i;
};
const C c;

Perhaps the ctor contents could have been checked (most compilers already know enough to generate warnings for uninitialized members), but the current standard doesn’t require it. To appease the compiler, it is enough the user supplies any ctor.

2. Currently there are ways – or rather spec loopholes? – to still use the same compiler-generated constructor for const initialization.

struct C {int i;};
const C c1 = C();
const C c2 {};

– both are considered value initialization, distinct from the default initialization referred in this part of the standard.

3. Somewhat surprisingly, while this fails:

struct C {
C() = default;
int i;
};
const C c;

taking the ‘ = default’ out of the class declaration makes the program valid!

struct C {
  C();
  int i;
};
C::C() = default;
const C c;

While in this toy example the difference seems negligible, typically the ctor implementation does not appear in all translation units that use C’s declaration. Thus, the ctor implementation – and in particular whether it’s default or not – is invisible to the compiler, and the standard does not require it to take decisions based on an implementation it can’t see.

Standard Bug (?)

Take a closer look at the aforementioned rationale:

An uninitialized object that is also constant would not be able to be populated with meaningful values later

Sure about that?

struct C { volatile int i; };
const C c;
...

Beyond the various ways in which these well-meaning limitations can be bypassed, if the uninitialized member is volatile – the rationale is plain wrong. The code openly asserts that this uninitialized member can be modified anywhere else, even for a const object.

I did come across mentions of this, and one can hope that sometime soon (23?) the standard would make volatile an exception – but I personally feel C++ would have been better off leaving this niche alone. This particular limitation probably caused more head scratching than it saved.

Posted in C++ | Leave a comment

Checking if your Graphics software runs on GPU

What are we asking exactly?

This is actually not that easy to phrase. If you see anything on a screen, your software does make use of some graphics processing unit – but it is more likely you’re interested in particular capabilities of the GPU you’re running on. The device capabilities range wildly and the full details comprise hundreds and hundreds of fields in structs retrievable e.g. by DirectX API. One can –

  1. Choose a a few (or single) capabilities that are of interest and query only them,
  2. Make do with a vendor – i.e., ‘I’m running on an nVidia card’
  3. Use some abstraction of GPU ‘level’, that is hopefully available from one of the API sets.

In my own scenario the HW platform is controlled and the GPU choice is limited to (a) an integrated Intel graphics processor, (b) a known nVidia card. So my code choices were (2) and (3) – see more below.

If you have a GPU, why wouldn’t it be used?

If you have a GPU on your computer and your software wants to use it, why wouldn’t it be able to? The two reasons I came across are –

  1. Erroneous connectivity
    1. When you plug your monitor to a (desktop) motherboard socket and not a graphics card socket, some systems do not use the graphics card,
    2. When your laptop is mounted on a docking station (USB docking station in particular), sometimes the laptop’s motherboard takes the wrong decision.
  2. nVidia Optimus (1-paragraph survey, technical details)
  3. Is an attempt by nVidia to save laptop battery life by turning off the GPU when (they think) you’re not using it. On an Optimus-enabled laptop if you right click your desktop and choose ‘NVIDIA control panel/Manage 3D settings’, you’d be able to indirectly see and select the graphics output to use:

    Now according to the whitepaper a switch to the discrete NVIDIA GPU is triggered by DX, DXVA and CUDA calls – but no OpenGL calls. One does come across online complaints, however, that CUDA calls do not trigger the switching mechanism.

Each of these is solvable, but all I wanted was a way for the software to warn about such situations and prompt the user for action.

Native solutions

The task of querying the underlying device is a basic one, and every reasonable platform that makes use of the GPU offers such API.

  1. If you’re using DirectX – Create a DX device, then try to use it to call IDXGIAdapter::GetDesc. Check if the Device creation fails or DXGI_ADAPTER_DESC.VendorID is not nVidia. Check this example on MSDN.
  2. If you’re using CUDA – it has API to enumerate and query available devices – essentially, cudaGetDeviceProperties. One usage example is here.
  3. If you’re using OpenGL – create a dummy window and call glGetString(GL_VENDOR) to detect the OpenGL implementation used.

I’m sure there are also OpenCL, Vulkan, DirectCompute (etc. etc.) APIs for that, but that should be enough. Our SW operates on OpenGL so I went with the 3rd option and here’s a shameless copy/past of the code snippet I used, by Daniel Cornel:

bool VerifyRunningOnNvidia()
{
WNDCLASS wc = { 0 };
wc.lpfnWndProc = DefWindowProc;
wc.lpszClassName = L"DummyWindow";
RegisterClass(&wc);
HWND hWnd = CreateWindow(L"DummyWindow", NULL, 0, 0, 0, 256, 256, NULL, NULL, GetModuleHandle(NULL), NULL);

HDC hDC = GetDC(hWnd);
PIXELFORMATDESCRIPTOR pfd = { 0 };
pfd.nSize = sizeof(pfd);
pfd.nVersion = 1;
pfd.dwFlags = PFD_DRAW_TO_WINDOW | PFD_SUPPORT_OPENGL | PFD_DOUBLEBUFFER;
pfd.iPixelType = PFD_TYPE_RGBA;
pfd.cColorBits = 24;
pfd.cDepthBits = 16;
pfd.iLayerType = PFD_MAIN_PLANE;
int pixelFormat = ChoosePixelFormat(hDC, &pfd);
SetPixelFormat(hDC, pixelFormat, &pfd);
HGLRC hRC = wglCreateContext(hDC);
wglMakeCurrent(hDC, hRC);

// Check the device information. Vendor chould be Intel for the integrated GPU
// and NVIDIA for the discrete GPU
const char* GpuVendor = (const char*)glGetString(GL_VENDOR);

bool IsNvidia = 0 == strcmp(GpuVendor, "NVIDIA Corporation");

// Destroy the OpenGL context
wglMakeCurrent(NULL, NULL);
wglDeleteContext(hRC);
ReleaseDC(hWnd, hDC);
DestroyWindow(hWnd);

return IsNvidia;
}

Managed solution

Enter System.Windows.Media.RenderCapability class, and specifically its Tier member. It provides a 3-values abstraction of the GPU ‘level’, which I expect should be enough for all but AAA game developers. Some of the descriptions given seem specific to the context of WPF (“…graphics features of WPF will use hardware acceleration…”) but truth is it suffices as a basic GPU query for all needs. The mapping to DirectX versions seems rather heuristic, and if you care about it there’s a good chance WPF is not the tool for you in the first place.

As an added bonus WPF provides an event that digs deep enough into the OS to give you a hook to respond to Render Tier change – which (afaik) is more than any other graphics framework provides. Such a change might occur if the user re-plugs the monitor to a different socket at runtime, or docks/undocks his laptop.

Here’s the relevant code snippet:

using System.Windows.Media;

...
void SomeEarlyInit()
{
...
    CheckRenderTier(null, null);
    RenderCapability.TierChanged += CheckRenderTier;
...
}

private void CheckRenderTier(object sender, EventArgs e)
{
    int renderingTier = RenderCapability.Tier >> 16;
    if (renderingTier < 2)
        MessageBox.Show("Graphics card inaccessible. Application requires an active GPU to function properly", "Warning");
}
Posted in DirectX, Win32 | 1 Comment

On OMP_WAIT_POLICY

Some years ago I encountered a crash that I reduced down to the following toy code, composed of a dll:

// DLLwithOMP.cpp : build into a dll *with* /openmp
#include <tchar.h>
extern "C"
{
   __declspec(dllexport)  void funcOMP()
   {
#pragma omp parallel for
    for (int i = 0; i < 100; i++)
        _tprintf(_T("Please fondle my buttocks\n"));
   }
}

and a console app:

// ConsoleApplication1.cpp : build into an executable *without* /openmp

#include <windows.h>
#include <stdio.h>
#include <tchar.h>

typedef void(*tDllFunc) ();

int main()
{
    HMODULE hDLL = LoadLibrary(_T("DLLwithOMP.dll"));
    tDllFunc pDllFunc = (tDllFunc)GetProcAddress(hDLL, "funcOMP");
    pDllFunc();
    FreeLibrary(hDLL);  // !  BOOM  !
    return 0;
}

As emphasized and commented, FreeLibrary causes a crash – typically (but not always) an access violation, with weird stacks in weird threads:

To understand what happens, let’s go over the full flow of events.

  1. The app loads the dll.
  2. The dll makes use of openmp, and thus the openmp runtime (part of the VC redist package) is loaded. It is a single dll, named vcomp[%VS_VER%][d].dll. ([d] when you’re running a debug build).
  3. The OMP runtime opens its own thread pool, and does some work.
  4. The work ends and the dll function returns.
  5. The app frees the dll
  6. vcompXXX.dll refcount is decremented to zero (since the app doesn’t use it). vcompXXX.dll is thus unloaded as well.
  7. The threads in the OMP thread pool keep spinning, but the code they’re running has just been unloaded! The rug had been pulled from under their feet and they crash spectacularly – while their stack frame seems to point somewhere in outer space.

This much I understood myself. What remained unclear was what is the correct solution. Was this an OMP implementation bug? Was there some OMP cleanup API that I missed? (not for lack of searching) Are we stuck with a (weird) requirement that components which call into OMP-linked-components, must link against OMP themselves??

I went first on StackOverflow and then on Connect (hey, it was 2015). As often happens in Connect reports, it was arbitrarily deleted some time later. Part of Eric Brumer’s response I did document at the SO post:

for optimal performance, the openmp threadpool spin waits for about a second prior to shutting down in case more work becomes available. If you unload a DLL that’s in the process of spin-waiting, it will crash in the manner you see (most of the time).

You can tell openmp not to spin-wait and the threads will immediately block after the loop finishes. Just set OMP_WAIT_POLICY=passive in your environment, or call SetEnvironmentVariable(L”OMP_WAIT_POLICY”, L”passive”); in your function before loading the dll. The default is “active” which tells the threadpool to spin wait. Use the environment variable, or just wait a few seconds before calling FreeLibrary.

MSDN explicitly mentions (for many versions now) that VC supports only OpenMP 2.0. OMP_WAIT_POLICY is part of the newer OpenMP 3.0 specification, and is the only newer environment variable that MS implemented. There’s a good chance they did it as part of this 2012 hotfix – and in the 5 years since, it remains undocumented.

Eric Brumer did mention in his Connect answer that he will nudge the documentation team to add it – but that either didn’t happen or didn’t help. Oh well, these tidbits are what keeps me blogging occasionally.

Posted in C++, VC++ | 2 Comments

Matlab’s mxArray Internals

Everything in Matlab is a Matrix. The scalar 4 is a 1×1 matrix with the single value 4. The string ‘asdf’ is a 4×1 (not a typo – it is in fact a column vector) matrix, with the 4 char values ‘a’, ‘s’, ‘d’, ‘f’, etc. When writing MEX functions in C/C++ (MEX = Matlab Extension), or when feeding data to Matlab-compiled components it is revealed that the underlying unified type for (almost) all Matlab data is the C type mxArray.

It seems that in the distant past (10Y+) Mathworks did deploy headers with the real type definition, but today mxArray is a completely opaque type – it is passed around only via pointers, and its only public declaration is a forward one, in matrix.h:

/**
 * Forward declaration for mxArray
 */
typedef struct mxArray_tag mxArray;

The only serious attempt I’m aware of to reverse mxArray’s layout is this 2000 user-group posting by Peter Boettcher. Twelve years later Peter Li published this work – which is very partial, relies on ‘circumstantial’ evidence and not on investigation of disassembly, and contains multiple errors. The memory layout of mxArray changed considerably since both works, and it is high time for a new investigation.

Below I hope to do more than spill out the results – rather lay out the complete way to improve this work and reproduce it in the future. (when mxArray’s layout changes and re-reversing is needed).

The Setup

Matlab installation includes the useful file  [matlabroot]/extern/examples/mex/explore.c, which demonstrates usage of most mxArray-poking API. To use it –

  1. Build it from the matlab prompt:
    >> mex -g ‘C:\Program Files\MATLAB\R2017a\extern\examples\mex\explore.c’
    (assuming matlabroot is ‘C:\Program Files\MATLAB\R2017a).
    This would create explore.mexw64 in your current folder – make sure you have write permissions to it. The -g switch generates debug symbols, to enable you to step through the generated code and watch variable contents in VS.
  2. Open explore.c in visual studio, set a breakpoint somewhere early at mexFunction():
  3. Attach to the running instance of matlab.
  4. From the matlab command prompt, create a variable of the type you wish to investigate and explore() it. E.g.:
    >> A=rand(3); explore(A)
  5. Step in VS and investigate the underlying mxArrays as detailed below. Repeat for various types.
    Expect to get obscure exceptions once in a while – they seem benign and handled internally by the jvm.

Start Simple

The first mx function called is mxGetNumberOfDimensions. It is the simplest getter possible, with two instructions:

This means that the mxArray member holding the number of dimensions is located at offset 24 (18 hex) from the mxArray start.

Similarly, mxGetPr disassembly shows that the real part of the data is at offset 56 (38 hex):

And the imaginary part of the data at offset 64 (40 hex):

mxIsSparse is an itzy bit more complicated:

Meaning, at offset 36 (24h) is a bit mask of size at least 8 (1 byte). The 5th bit from the right is a ‘sparse’ flag.

mxGetClassID has a little bit more complexity, but the basic location of the info is immediate:

The ClassID data is at offset 8 and it is of type mxClassID. The value 10h is the maximum allowed and values above it are subtracted by 17 before returning. Note that values above 16 are mentioned in matrix.h, but it seems these are not values you’d meet every day:

typedef enum {
    mxUNKNOWN_CLASS = 0,
...
    mxUINT64_CLASS,
    mxFUNCTION_CLASS, // = 16,
    mxOPAQUE_CLASS,
    mxOBJECT_CLASS, /* keep the last real item in the list */
#if defined(_LP64) || defined(_WIN64)
    mxINDEX_CLASS = mxUINT64_CLASS,
#else
    mxINDEX_CLASS = mxUINT32_CLASS,
#endif
    /* TEMPORARY AND NASTY HACK UNTIL mxSPARSE_CLASS IS COMPLETELY ELIMINATED */
    mxSPARSE_CLASS = mxVOID_CLASS /* OBSOLETE! DO NOT USE */
} mxClassID;

And so on and so forth. Much of mxArray’s contents are as apparent as in these examples, but not all. Hopefully these examples are enough to get a feel for the type of investigation required.

Conclusions (some, anyway)

  1. mxArray’s contents are very dense, and many of the members are unions – i.e., have different interpretations in different contexts. For one, dimensions: when number_of_dims (offset 24) is 2, they’re stored as two size_t members – which I called rowdim and coldim. When number_of_dims is greater than 2, the first member (rowdim) is actually a pointer to a heap array of dims, of size number_of_dims.
    The main data pointers (pData, pimag_data) are much larger unions – they can point to an array of anything, from doubles to complete mxArrays, depending on the mxClassID.
  2. Peter Boettcher’s 2000 work describes how Matlab uses ‘crosslinks’ between copies of the same variable to implement copy-on-write semantics. Some time later in the millennium Mathworks decided to trade space for speed, and added bi-directional such links, to save traversing the list of copies when one is changed: the layout as listed now includes both forward and backward crosslinks.
  3. Structs are rather complex. For a single struct –
    1. pData points to an array of mxArrays, containing the field values.
    2. The field names are accessed via 3 indirections:
      1. pimag_data points to a type I called struct_field_info.
      2. a member of struct_field_info points to another type I called struct_field_info_tag.
      3. a member of struct_field_info_tag (‘field_names’) is an array of pointers to null terminated ascii strings, holding the field names in order.
  4. Sparse matrices: the raw data is referenced by pData/pimag_data as for usual matrix. The data’s location is governed by the arrays irptr/jcptr, used to implement the Compressed-Sparse-Column storage and accessible directly via mxGetIr and mxGetJc. The size of these arrays (nnz) is stored at the member I called nelements_allocated.

Results

I imagine that even in the parts I did get right, the real mxArray headers greatly differ from my own. Since I’m interested only in watching mxArrays and not modifying them directly (as you should be too), I did not express, say, pData as a large union but rather as a single void*. The place where the content type manifests itself is inside the natvis file, in sections such as –

      <!--Dense Matrices-->
      <ArrayItems Condition="classID!=2 &amp;&amp; classID!=4 &amp;&amp; dataflags.sparse==false">
        <Direction>Backward</Direction>
        <Rank>number_of_dims</Rank>
        <Size Condition="number_of_dims==2">(&amp;rowdim)[$i]</Size>
        <Size Condition="number_of_dims!=2">((size_t*)rowdim)[$i]</Size>
        <ValuePointer Condition="classID==1">(mxArray_tag*)pData</ValuePointer>
        <ValuePointer Condition="classID==6">(double*)pData</ValuePointer>
        <ValuePointer Condition="classID==7">(float*)pData</ValuePointer>
        <ValuePointer Condition="classID==8">(char*)pData</ValuePointer>
        <ValuePointer Condition="classID==9">(unsigned char*)pData</ValuePointer>
        <ValuePointer Condition="classID==10">(short*)pData</ValuePointer>
        <ValuePointer Condition="classID==11">(unsigned short*)pData</ValuePointer>
        <ValuePointer Condition="classID==12">(int*)pData</ValuePointer>
        <ValuePointer Condition="classID==13">(unsigned int*)pData</ValuePointer>
        <ValuePointer Condition="classID==14">(__int64*)pData</ValuePointer>
        <ValuePointer Condition="classID==15">(unsigned __int64*)pData</ValuePointer>
      </ArrayItems>

Here’s a simple example of the resulting watches:

double_expand


While this work is partial – I stopped where it was useful enough to us – it might be of value as is. It is now on github, you’re welcome to use/improve/report issues. The license is as free as I know how to make it.  If you want to learn a bit more about the natvis syntax, here’s where to do it.

The easiest way to use it is to add mxArrayWatch.h and mxArrayWatch.natvis to your c++ project which uses mxArray’s.

MathWorks Plea

My guess is that you guys decided to hide mxArray’s layout after users wrote code that relied on undocumented specifics, the code broke when you upgraded the layout, and unnecessary burden on your support ensued. I can completely relate to that. However, I’m not sure you have a realistic picture of the price your customers pay.

Let’s take a far more ubiquitous runtime as an example – MS CRT. Microsoft have been exposing nearly all of its source – type internals and logic – for at least 15 years now. STL and CRT types do change layout in major versions, code which illegally relied on internal layout comes crumbling down, I’m sure their support suffers as a result – but I dare guess their support would be burdened considerably more had they not opened the CRT source. In real life, more often than not, you just have to peek in.

Encapsulation is a solid design principle – but when taken to extremes it fails. In general, you really need zero knowledge of internals only when everything 100% succeeds on your first attempt, which is never the case in real life projects. Just the other day we had a nasty crash with memory corruption on mxDestroyArray – and it turned out the issue in the code was that we updated the field ‘costGap’ instead of ‘CostGap’. There is no way in the world we would have been able to debug this without reverse engineering the mxArray layout.

If you take interfacing with C/C++ seriously, I urge you guys to reconsider. Please don’t force the community to reverse your stuff to be able to work with it.

Posted in Debugging, Matlab, VC++ | 2 Comments

Tracking the Current Directory from the debugger: RtlpCurDirRef

Some rogue code was changing our current directory from under our feet, and we needed to catch it in action. I was looking for a memory location to set a data breakpoint on.

(Note: for the remainder of this post it is assumed that ntdll.dll symbols are loaded.)

The High road

The natural repository for process-wide data is the Process Environment Block and indeed you can get to the current directory from the there. The PEB and its internal structures are almost entirely undocumented, but the venerable Nir Sofer (and others) got around it using MS public debug symbols: the path is PEB->ProcessParameters->CurrentDirectory. After translating the private field locations to offsets, you get a rather horrifying – but functional – expression, that you can paste in a watch window:

(((_CURDIR*)&((((((PTEB)$TIB)->ProcessEnvironmentBlock)->ProcessParameters)->Reserved2)[5]))->DosPath).Buffer

To break execution when your current folder changes, you can set a data breakpoint on:

&(((((PTEB)$TIB)->ProcessEnvironmentBlock)->ProcessParameters)->Reserved2)[5]

An Easier Alternative

Interestingly when inspecting GetCurrentDirectory disassembly it turns out it doesn’t go the TEB/PEB way, but takes a detour:

Ntdll.dll!RtlpCurDirRef is undocumented, but is included in the public ntdll debug symbols and so can be used in the debugger. The Cygwin guys mention it as the backbone of their unix-like cwd command, and their _FAST_CWD_8 type seems to still accurately reflect the windows type (as of July 2017). If you’re willing to modify your source to enable better variable watch go ahead and add –

typedef struct _FAST_CWD_8 {
LONG           ReferenceCount;
HANDLE         DirectoryHandle;
ULONG          OldDismountCount;
UNICODE_STRING Path;
LONG           FSCharacteristics;
WCHAR          Buffer[MAX_PATH];
} FAST_CWD_8, *PFAST_CWD_8;

And inspect in the debugger:

If you can’t or don’t want to modify the source, you can set the watch with a direct offset –

(*(wchar_t**)ntdll.dll!RtlpCurDirRef)+22

SetCurrentDirectory() replaces the contents of RtlpCurDirRef, so you can set a data breakpoint directly on it.

Posted in Debugging, VC++, Win32 | 1 Comment

Checking Memory Corruption from the debugger in 2016

It used to be something like

{,,msvcr80d.dll}_CrtCheckMemory()

But this trick requires quite a bit of adaptation to use on modern VS versions.

First, the relevant module is now ucrtbased.dll – thanks to the universal CRT the expression is no longer version-dependent.

Second, the ugly context operator syntax – while still accepted – has an alternative in the module!function windbg-like form.

Even after these two fixes, more is needed. Type in a watch window ucrtbased.dll!_CrtCheckMemory(), and the value shown is –

No type information is available for the function being called. If you are calling a function from another module, please qualify the function name with the name of the module containing it.

The type information is definitely there – but don’t sweat it, just add the type information yourself:

((int (*)(void))ucrtbased.dll!_CrtCheckMemory)()

Posted in Debugging, VC++ | 2 Comments

CMake Rants

CMake is a highly popular ‘meta-build’ system: it is a custom declarative syntax that is used to generate build scripts for all major OSs and compilers (e.g., VS solutions and projects). Designing such a system is a formidable task, but really not a very wise one to undertake in the first place.

I know there are only languages that people complain about and languages nobody uses. I know it’s bad manners to complain about stuff you get for free. I also know I’m working on windows and CMake scripts are generally authored by people who don’t care much about windows development.

And still I can’t help it. Here are a few particular irks.

Terminology

When CMake asks ‘where to build the binaries’ it isn’t talking about anything resembling a binary. It’s asking about the proper location for the outputs of its processing – i.e., solutions and projects (or other build scripts).

UI

This goes beyond a simple ‘designed by an engineer’ cliché. How long did it take you to figure out you need to repeatedly click the ‘configure’ button until all red lines are gone, then ‘Generate’?

Syntax

Not so good.

Clean/Rebuild

..is generally just a recommendation.

But what really makes CMake nearly unusable to me is –

CMake’s treatment of paths

In all generates build scripts, paths are absolute. In vcxproj’s – Output path, Additional Include Directories, PDB path, Linker input directories, custom build steps in ZERO_CHECK and ALL_BUILD, etc. etc. – are all absolute paths.

This makes CMake-generated projects almost useless: you cannot source control them or share them in any other way.

Turns out this has been known for quite some time. There’s a macro called CMAKE_USE_RELATIVE_PATHS but its documentation says:

May not work!… In general, it is not possible to move CMake generated makefiles to a different location regardless of the value of this variable.

It seems they tried to fix it for a while but gave up, and instead posted a FAQ which I don’t really understand:

CMake uses full paths because:

  1. configured header files may have full paths in them, and moving those files without re-configuring would cause upredictable behavior.
  2. because cmake supports out of source builds, if custom commands used relative paths to the source tree, they would not work when they are run in the build tree because the current directory would be incorrect.
  3. on Unix systems rpaths might be built into executables so they can find shared libraries at run time. If the build tree is moved old executables may use the old shared libraries, and not the new ones.

Can the build tree be copied or moved?

The short answer is NO. The reason is because full paths are used in CMake, see above. The main problem is that cmake would need to detect when the binary tree has been moved and rerun. Often when people want to move a binary tree it is so that they can distribute it to other users who may not have cmake in which case this would not work even if cmake would detect the move.

The workaround is to create a new build tree without copying or moving the old one.

The way I see it the real reasons for this sorry state are laid out in this 2009 discussion:

You should give up on CMAKE_USE_RELATIVE_PATHS , and we should deprecate it from CMake.  It just does not work, and frustrates people.

… It is really hard to make everything work with relative paths, and you don’t get that much out of it, except lots of maintenance issues and corner cases that do not work.

An alternative that I’m growing fond of

Is ‘Project from existing code’:

Download the sources you wish to use, and instead of invoking CMake on the root CMakeLists.txt, invoke ‘Project from existing’ code, select the source folder and follow the rest of the wizard instructions.

Today this approach worked for me perfectly on the first try (on this library that is admittedly simple in structure), but that was just lucky. It certainly isn’t perfect – but it is simple, and the generated project files do use relative paths. I’m beginning to think even when tweaks are needed, this is a better starting point for a usable project. Do tell me in the comments if your experience is different.


Edit:

It seems some words of clarification about my usage scenario are in order.

I wish to import an open source project to my build environment, and continue from there. With my build environment. Is that such an exceptional scenario? (It might be, judging by the comments below). I was under the impression that this is what CMake authors aimed for (why generate a VS project/solution otherwise?), and if I was creating an open source package that is how I would want others would use my code.

Moreover, except in the simplest of cases this is the only way to go: a CMake-generated project cannot possibly be the final say. All native build engines have their special knobs and handles that often must be tweaked. Did you ever, e.g., want to change the import library for a dll? Not really possible in CMake. Not to mention more advanced stuff – e.g., rebase it or make it ASLR.  I didn’t mention it above because I don’t consider this a CMake flaw – it’s just too much to ask of a portable build system. All you can expect from it is to set a portable common ground.

So I would expect CMake to generate a native build package (say, VS solution) in a way that would make it possible to forget it was generated by CMake.   Due to all the native knobs and handles this is an inherently hard user story to implement – but CMake fails much, much earlier. I’d consider using relative paths a must-have, and I don’t see why portability makes this task any harder than, say MSBuild authors’ task of using relative paths.

Posted in C++ | 19 Comments

On Matlab’s loadlibrary, proto file and pcwin64 thunk

Today we’ll try to shed some light on dark undocumented corners of Matlab’s external interfaces.

Matlab provides several ways to call into external native code – if you have just the binaries for this code, the way is loadlibrary.  To help parse the external dll contents you’d need to initially provide loadlibrary a C/C++ header file, but you can then tell loadlibrary to transform this header info into a Matlab-native representation typically named a ***proto.m file.  When the proper loadlibrary call is made, a proto.m file is generated along with something named ***_pcwin64_thunk.dll (well, on x64 pc’s, obviously).  The documentation says nearly nothing about either proto files or thunk files:

A prototype file is a file of MATLAB commands which you can modify and use in place of a header file. …

A thunk file is a compatibility layer to a 64-bit library generated by MATLAB.

One could do with this terse phrasing until something goes wrong – as it inevitably does.  Googling shows only that this seems to be an open question online as well. Time to peek inside.

Peeking inside

Take a toy C++ dll:


// ToyDLL.h
#ifdef TOYDLL_EXPORT
#define TOYDLL_API __declspec(dllexport)
#else
#define TOYDLL_API __declspec(dllimport)
#endif

extern "C" { TOYDLL_API bool ToyFunc(int a, int b, double c); }

// ToyDLL.cpp: build with /D TOYDLL_EXPORT

#include "ToyDLL.h"
#include <stdio.h>
#include <tchar.h>

extern "C" {
	TOYDLL_API bool ToyFunc(int a, int b, double c)
	{
		_tprintf(_T("%d, %d, %f"), a, b, c);
		return true;
	}
}

Build it, try to loadlibrary it in Matlab, and get:

Error using loadlibrary
Call to Perl failed.  Possible error processing header file.
Output of Perl command:
Working string is 'extern " C " {  bool ToyFunc ( int a , int b , double c ); }'.
at C:\Program Files\MATLAB\R2016a\toolbox\matlab\general\private\prototypes.pl line 1099
main::DumpError('extern "C" { found in file. C++ files are not supported.  Use...') called at C:\Program Files\MATLAB\R2016a\toolbox\matlab\general\private\prototypes.pl line 312
ERROR: extern "C" { found in file. C++ files are not supported.  Use #ifdef __cplusplus to protect.

Found on line 13 of input from line 12 of file ToyDLL.h

Hmmmm. The perl script prototypes.pl is shipped with Matlab (the error message above gives its full path), and the first few of its 1000 lines are:

# Parse a C/C++ header file and build up three data structures: the first
# is a list of the prototypes defined in the header file; the second is
# a list of the structures used in those prototypes.  The third is a list of the
# typedef statements that are defined in the file

It should be noted already that the C – C++ boundary is extremely fuzzy as far as Matlab is concerned. Not only is this script declared to ‘Parse C/C++ headers’ only to complain later that ‘C++ is not supported’, loadlibrary itself is advertised to ‘Load C/C++ shared library into MATLAB’ only to disclaim elsewhere that ‘The MATLAB® shared library interface supports C library routines only’ and offer various workarounds for C++.  More details later, but for now let’s humor the grumpy perl script and modify the header (it never touches the cpp) into:

// ToyDLL.h
#ifdef TOYDLL_EXPORT
#define TOYDLL_API __declspec(dllexport)
#else
#define TOYDLL_API __declspec(dllimport)
#endif

#ifdef __cplusplus
extern "C" {
#endif

TOYDLL_API bool ToyFunc(int a, int b, double c);

#ifdef __cplusplus
}
#endif

And now loadlibrary quietly succeeds.

Peeking deeper inside

As the perl source is available you could in principle study it to understand what it does – but I certainly couldn’t, in principle or not (it’s horrible even as far as perl scripts go). With some semi-hacking, we can just inspect its output. First, fire up Process Monitor and filter to process ‘perl.exe’ to observe the exact files it receives and generates:

ToyDLL

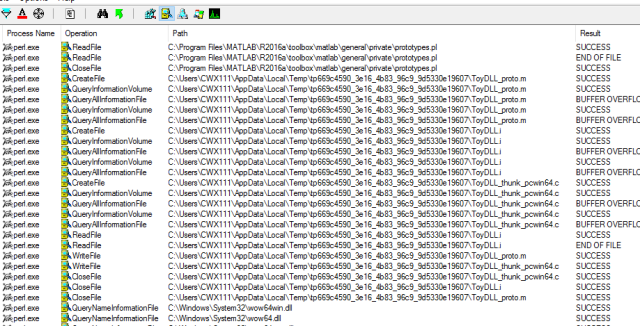
Observe that the perl script operates on the VC-preprocessed file ToyDLL.i   This could also be seen by examining earlier portions of the ProcMon trace or by noting that prototypes.pl itself declares internally its usage as –

# prototypes [options] [-outfile=name] input.i  [optional headers to find prototypes in]

Next, observe that it outputs the source file ToyDLL_thunk_pcwin64.c.  Alas, trying to open it teaches that it is very short lived.  The final hack is to copy this temp file somewhere upon its creation. I considered coding such a tool (shouldn’t be too much trouble) but thought I’d google for one first and luckily did come across the free edition of Limagito. After some tweaking (*Edit: more details below) I got a nice persistent copy of the thunk.c source, which is essentially:

…
#include <tmwtypes.h>

/* use BUILDING_THUNKFILE to protect parts of your header if needed when building the thunkfile */

#define BUILDING_THUNKFILE

#include "ToyDLL.h"

/*  bool ToyFunc ( int a , int b , double c ); */
EXPORT_EXTERN_C bool boolint32int32doubleThunk(void fcn(),const char *callstack,int stacksize)
{
int32_T p0;
int32_T p1;
double p2;
p0=*(int32_T const *)callstack;
callstack+=sizeof(p0) % sizeof(<em>size_t</em>) ? ((sizeof(p0) / sizeof(<em>size_t</em>)) + 1) * sizeof(<em>size_t</em>):sizeof(p0);
p1=*(int32_T const *)callstack;
callstack+=sizeof(p1) % sizeof(<em>size_t</em>) ? ((sizeof(p1) / sizeof(<em>size_t</em>)) + 1) * sizeof(<em>size_t</em>):sizeof(p1);
p2=*(double const *)callstack;
callstack+=sizeof(p2) % sizeof(<em>size_t</em>) ? ((sizeof(p2) / sizeof(<em>size_t</em>)) + 1) * sizeof(<em>size_t</em>):sizeof(p2);
return ((bool (*)(int32_T , int32_T , double ))fcn)(p0 , p1 , p2);
}

For completion, here is the generated ToyDLL_proto.m file:

function [methodinfo,structs,enuminfo,ThunkLibName]=ToyDLL_proto
%TOYDLL_PROTO Create structures to define interfaces found in 'ToyDLL'.
%This function was generated by loadlibrary.m parser version  on Fri Jul 15 17:50:20 2016
%perl options:'ToyDLL.i -outfile=ToyDLL_proto.m -thunkfile=ToyDLL_thunk_pcwin64.c -header=ToyDLL.h'
ival={cell(1,0)}; % change 0 to the actual number of functions to preallocate the data.
structs=[];enuminfo=[];fcnNum=1;
fcns=struct('name',ival,'calltype',ival,'LHS',ival,'RHS',ival,'alias',ival,'thunkname', ival);
MfilePath=fileparts(mfilename('fullpath'));
ThunkLibName=fullfile(MfilePath,'ToyDLL_thunk_pcwin64');
%  bool ToyFunc ( int a , int b , double c );
fcns.thunkname{fcnNum}='boolint32int32doubleThunk';fcns.name{fcnNum}='ToyFunc'; fcns.calltype{fcnNum}='Thunk'; fcns.LHS{fcnNum}='bool'; fcns.RHS{fcnNum}={'int32', 'int32', 'double'};fcnNum=fcnNum+1;
methodinfo=fcns;

Putting it all together

Now that all the raw material is at hand, we can gain some insight on what these components do and how.

The proto file is about calling the thunk

It contains the path to the thunk dll, and a ‘dictionary’ that tells Matlab what thunk function needs to be called en route to each dll-exported function. For our toy case, to get to ToyFunc Matlab calls into ‘boolint32int32doubleThunk’ – a name encoding the output and all input types, but in principle every other name could be used.

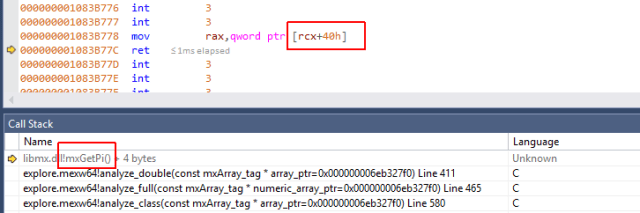
The thunk DLL is about adjusting calling conventions

The thunk function boolint32int32doubleThunk receives its arguments in the Matlab calling convention: all arguments are passed consecutively on the stack, untyped and aligned on sizeof(size_t) (64 bytes in x64) boundaries.  It also receives a function pointer to the actual DLL export, and after copying the arguments to local typed variables – calls this function with its native calling convention.  It never uses the ‘stacksize’ argument.

In real life cases the headers and generated thunks can get considerably more complicated – one notable omission so far is how structs and other compound types are handled (as far as I can tell this is the sole reason for inclusion of the library header in the thunk.c). The same technique laid out above can be used to investigate these cases, but we can already put all this newfound knowledge to good use.

Troubleshooting

Take our ToyDLL.h above and add to it the seemingly benign lines:

class ToyClass
{
ToyClass() {};
~ToyClass() {};
};

Build and try to load the resulting DLL into Matlab, only to get:

Error using loadlibrary
Building ToyDLL_thunk_pcwin64 failed.  Compiler output is:
cl -I"C:\Program Files\MATLAB\R2016a\extern\include" /Zp8  /W3  /nologo
-I"[…]ToyDLL" "ToyDLL_thunk_pcwin64.c" -LD -Fe"ToyDLL_thunk_pcwin64.dll"
ToyDLL_thunk_pcwin64.c
[…]\ToyDLL\ToyDLL.h(10): error C2061: syntax error: identifier 'ToyClass'
[…]ToyDLL\ToyDLL.h(10): error C2059: syntax error: ';'
[…]ToyDLL\ToyDLL.h (11): error C2449: found '{' at file scope (missing function header?)
[…]ToyDLL\ToyDLL.h (14): error C2059: syntax error: '}'

We didn’t violate any of loadlibrary’s documented limitations but we already have enough visibility into the process to understand what’s going on.  The root issue is that for whatever reason the perl script generates a c file, not a cpp one.

The workaround I used, both in this toy scenario and in the real life DLLs I wanted to load into Matlab, was – grab the perl-generated sources, rename them to cpp and build your own thunk.dll .

In the immortal words of Todd Howard, It just works.   Solves plenty of other C/C++ idiosyncrasies too.

Now I have exactly zero insight into Mathworks considerations and decisions, but I have this vague suspicion the only reason for these half-hearted ‘C-only’ limitations is that they’re stuck with this essentially black-box perl script that parses headers.  Most of the time it succeeds (on C++ headers too), sometimes it doesn’t. When it doesn’t, they sometimes document the root cause as unsupported.

The question remains, who in their right mind would try to parse a header with a perl script. Based on my own experience, I can suggest sort of an answer.

Bonus

This discussion can lead to all sorts of other workarounds and solutions. Here’s, briefly, another one that was useful to us.

When the Matlab component consuming the native DLL is deployed, the loadlibrary call is made from wherever the CTF archive was extracted to – and it occasionally fails to find the thunk dll. Our solution was to intervene in the proto.m file, and have it take the thunk path from the registry.

Perhaps more on CTF archives one day.


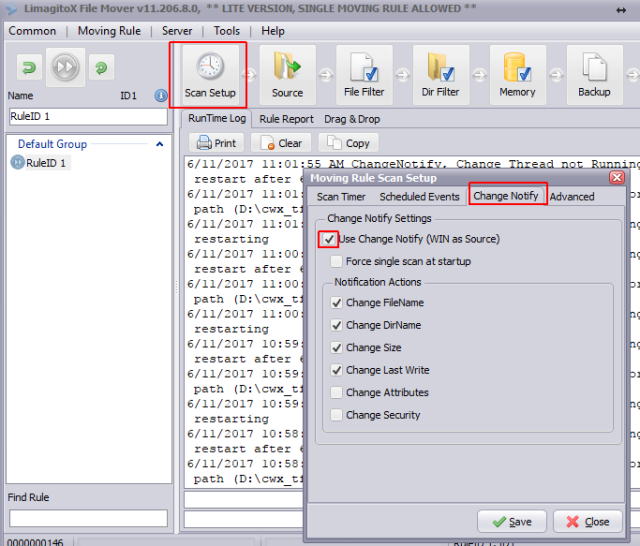
Edit June 2017: Per @AlishaMenon’s request, here are some more details about the Limagito usage.

First, under Scan Setup/Change Notify/WIN source:

limagito1

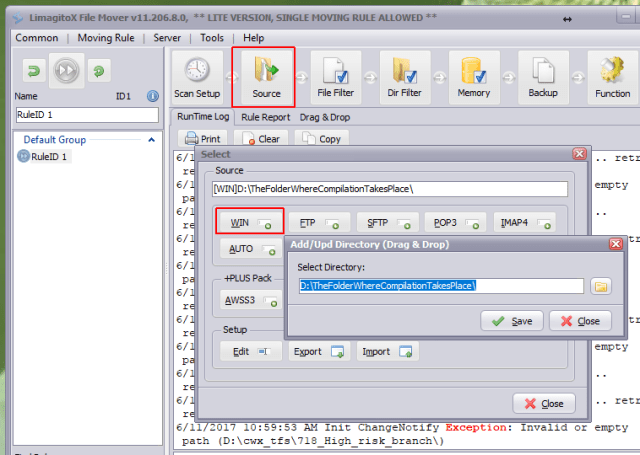
Second, set the directory where compilation takes place (where the temp files are generated) under Source/WIN:

limagito2

Finally set the destination folder where you want the copy:

And you should be good to go.


Edit 2020: Turns out the gymnastics for grabbing the temporary ToyDLL_thunk_pcwin64.c file were redundant all along. You can just use the undocumented loadlibrary option: “notempdir”. If you do, the temporary files (ToyDLL_thunk_pcwin64.c and others) will stay in place for you to play with.

Posted in Matlab, VC++ | 15 Comments

On API-MS-WIN-XXXXX.DLL, and Other Dependency Walker Glitches

Dependency walker is the tool of choice for static dependency analysis of native binaries (it has some dynamic analysis too, but that niche at least has some alternative solutions). It is in a rather sorry state, however – development seems to be abandoned since more or less 2005, and it is unanimously described as aging. As a prominent example of dependency walker analysis failures, try to run it on itself:

It seems the dependencies it is able to resolve are a negligible minority of the overall dependencies – and the interwebs are full of similar reports. The DLLs falsely reported as missing are all strangely named and unfamiliar, and the explanations given as SO answers range from a vague ‘some internal OS stuff’ to hypotheses about delay loads and side-by-side assemblies.

To the best of my understanding, as of March 2016 DependencyWalker 2.2 resolves side-by-side manifests very well and has no trouble with delay loads. I’m aware of only two dependency scenarios where it falls short, but unfortunately they are ubiquitous.

1: Compatibility Shims

Maybe more on that in another post. But –

2: Api Sets

…are the main issue.

Scarcely mentioned on MSDN:

An API Set is a strong name for a list of Win32 APIs … you should think of an API Set’s name as just a unique character string, and not as a dll name … API Sets rely on operating system support in the library loader … the library loader performs a runtime redirection of the reference…

Don’t be alarmed if that still sounds opaque. Brief history, as I understand it:

Sometime in the Vista dev cycle an effort referred to as MinWin began: essentially, smart people started moving functionality around in hope of simplifying the OS architecture. To protect the myriad components from breaking during a change, the ultimate solution was called in: an extra layer of indirection. This level is exactly Api Sets.

For example, the API set “api-ms-win-core-fibers-l1-1-1.dll” is an ‘atom’ of functionality encompassing the 5 APIs FlsAlloc, FlsFree, FlsGetValue, FlsSetValue and IsThreadAFiber (it is an untypically small such ‘atom’). All applications that consume fiber functionality declare dependency on this API set, and thereby become insensitive to the exact location of implementation (that might change between OS releases). During load time, the OS searches somewhere and automagically routes the calls from api-ms-win-core-fibers-l1-1-1.dll to wherever they happen to be implemented in this OS version.

One could argue that API sets now serve the original intended role of DLLs and that the architecturally clean solution is to have each API set implemented in its own DLL, but I’m sure this tradeoff has performance implications that I cannot even begin to quantify.

Some Internals

API sets are very partially documented, and the load-time mechanism that properly routes the calls – even less so. One could start by inspecting the shipped apiset.h (documented to be authored by the venerable Arun Kishan in Sep-2008), and learn that the key call is to the undocumented ApiSetResolveToHost. It is called from LoadLibrary, typically through a call stack such as –

ntdll.dll!_ApiSetResolveToHost@20()  + 0xf bytes
ntdll.dll!_LdrpApplyFileNameRedirection@28()  + 0x35 bytes
ntdll.dll!_LdrpLoadDll@24()  + 0xae bytes
ntdll.dll!_LdrLoadDll@16()  + 0x74 bytes
KernelBase.dll!_LoadLibraryExW@12()  + 0x120 bytes

The actual per-OS-version redirection data lies in a special file called ApiSetSchema.dll. Its technically a DLL (conforms to the PE spec), but not an executable one – the redirection data lies in a specialized section called .apiset, mentioned at the apiset.h macros. Sebastien Renaud did some spectacular reversing work and described the layout of the redirection data it contains.

Full(er) Redirection Table

In principle one could – and hopefully someday would – use Renaud’s work to create a community-maintained version of dependency walker, but until that day we can get by with the aforementioned built-in loader logging: whenever ShowSnaps is raised the loader spits out many hundreds of messages like –

3e30:02b8 @ 370478046 – LdrpPreprocessDllName – INFO: DLL api-ms-win-core-rtlsupport-l1-2-0.dll was redirected to C:\WINDOWS\SYSTEM32\ntdll.dll by API set

Running a few applications and filtering the results, I arrived at the table dumped below. I’ll update it as time permits – but if you have some dependency you don’t understand you can follow the same steps (well, for apps you can run, anyway): raise ShowSnaps for your app and inspect the output to see where the ApiSet I missed really routes to. If you do, please comment here so I can correct the table.

API Set Routes to…
api-ms-win-appmodel-state-l1-2-0.dll kernel.appcore.dll
api-ms-win-core-apiquery-l1-1-0.dll ntdll.dll


Edit (May 2016):

I won’t be listing the API sets here, as it turns out Geoff Chappell already took upon himself to maintain a list of API set redirections, along with versions and a very nice survey of the underlying apparatus, and actually a link to an MS patent describing the apparatus (if you’re able to decipher such descriptions).

Posted in Win32 | 22 Comments

Data Read Breakpoints – redux

The Problem

~5Y ago I blogged about data breakpoints. A hefty bit of the discussion was devoted to persistence of hardware breakpoints across a thread switch: all four implementations mentioned assume that HW breakpoints persist across thread boundaries, and some rough testing showed that that was indeed the case back then. Alas, somewhere between Windows 7 and Windows 10 – this assumption broke. The naïve implementation via SetThreadContext now indeed sets the debug registers only in the context of a specific thread. I suspect a deep change in the OS scheduler broke it – possibly hardware tasks are used today where they previously weren’t, but I have no proof.

Failed Attempts

I’m aware of a single attempt to address this shortcoming and implement a truly cross-thread data breakpoint: a year ago my friend Meir Meshi published code that not only enumerates all existing threads and sets debug registers in their context, but also hooks thread creation (actually RtlCreateThread) via a coded assembly trampoline to make sure any thread created henceforth would respect the existing breakpoints. The code seemed to work marvelously for a while, and broke again in Windows 10 – where MS understandably recognizes patching of thread creation as an exploit, and bans it.

I set out to find a working alternative to hooking thread creation. Two immediate directions popped to mind: DLL_THREAD_ATTACH and the lesser known TLS callbacks. These are two documented hooks available to user mode upon thread creation, and seemed like a natural place to access a list of pre-set breakpoints and apply them to the context of new threads. Both these attempts fell short again, since it seems these hooks are called before the target thread is created (from the stack of a different process thread), and setting the debug registers in this context does not persist to the target thread.

Bottom line, it seems that as of 2016 you really have to be a debugger and handle CREATE_THREAD_DEBUG_EVENT to manage hardware breakpoints. I was recently told by John Robbins that the VS team are aware of this need but it just isn’t currently a priority (this might change if this UserVoice suggestion gets a bit more votes, though). Luckily, VS isn’t the only debugger in the MS universe – and in fact it integrates with a much stronger one.

A Real Solution

WinDBG (and siblings) had perfect hardware breakpoints (via ‘ba‘) since forever. It is a less known fact that VS integrates rather nicely with WinDBG, and for completeness I’ll rehash the integration steps here.

(1) Install WDK , and mark the integration with VS checkbox.

(2) Run the debugee without a debugger (Ctrl+F5) and attach to it via the newly added ‘Windows User Mode Debugger’ transport:

The debugging engine is now WinDBG. The debugging experience is noticeably different: the expression evaluator is different – e.g. the view at the watch window and what it agrees to process are changed, threads pane no longer has thread IDs (why??) etc. – but all in all the large majority of VS commands and keyboard shortcuts are nicely mapped to this new engine.

You should see a new ‘Debugger Immediate Window’ pane, that accepts command line inputs identical to that of WinDBG, and with a nice bonus of auto-completes and auto help:

While at a breakpoint, type a ba command at this window. For example, to break upon read (r) of any of the 4 bytes (r4) following the address 0x000000c1`3219f7f4 (the windbg engine likes a ` separator in the middle of x64 addresses), type:

ba r4 0x000000c1`3219f7f4

And enjoy your shiny new read breakpoints that works across existing threads and are inherited by newly created ones.

Posted in Debugging, Visual Studio | 1 Comment