Naming threads

There is a nice feature that is all but undocumented, and has next to no web presence too:  you can give your threads meaningful names.

While this is trivial in managed code, it is hardly obvious for native.  The TIB (the internal thread administration data table) does not include a name slot, so there’s not much use looking for some SetThreadName(…) API in win32.

Anyway, the MS debuggers (both Visual Studio and the WinDbg family) have a secret trap door just for that:  the exception 0x406D1388.  When raised, the debugger (obviously) gets a first-chance of handling it. This exception can carry thread-naming info, in an undocumented THREADNAME_INFO type, and the debuggers can interpret this info and internally attach that name to that thread ID.  A quick rehash of the MSDN code:

//
// Usage: SetThreadName ("CurrentThread");
//        SetThreadName ("OtherThread", 4567);
//

typedef struct tagTHREADNAME_INFO
{
   DWORD dwType; // must be 0x1000
   LPCSTR szName; // pointer to name (in user addr space)
   DWORD dwThreadID; // thread ID (-1=caller thread)
   DWORD dwFlags; // reserved for future use, must be zero
} THREADNAME_INFO;

void SetThreadName( LPCSTR szThreadName, CONST DWORD dwThreadID = -1)
{
   THREADNAME_INFO info;
   info.dwType = 0x1000;
   info.szName = szThreadName;
   info.dwThreadID = dwThreadID;
   info.dwFlags = 0;

   __try
   {
      RaiseException( 0x406D1388, 0, 
              sizeof(info)/sizeof(ULONG_PTR), (ULONG_PTR*)&info );
   }
   __except(EXCEPTION_CONTINUE_EXECUTION)  {}
}

This can be a valuable debugging aid in multi-threaded apps – which today amounts to practically all of them.

Posted in Debugging, Visual Studio | 1 Comment

Debugging Native Memory Leaks, Part 1: LeakDiag

Leaking memory is probably the single most painful aspect of native code – its the reason managed was ever born.

At work, our code routes ‘new’ calls through_aligned_malloc_dbg. This CRT API, along with cousins like _malloc_dbg and _calloc_dbg, takes extra parameters containing a file name and line number, and so enables the CRT to report the exact location of an unreleased allocation upon process termination:

Sadly, this is useful only in the handful of cases where the code allocates directly. What if the offending allocation is performed via some common container routine? Even worse – what if the leak is properly de-allocated in destructors at shutdown time?  The CRT support would be of no use. Wouldn’t it be nice if we could see the entire stack that allocated unreleased memory?

There are two powerful, free, and vastly different tools from Microsoft, that achieve just that.

Enter LeakDiag!

I’m actually not sure how public this tool is. Two of its components, LeakDiag and LDGrapher are available on the public MS FTP, but a third one, LDParser, seems to be available only by Microsoft Premier Support. Anyway, both LDParser and LDGrapher only format the output, and LDGrapher can do most (but not all!) of what LDParser does.

LeakDiag does its magic by using Detours technology (fascinating read!) to intercept memory allocators calls. Detours enables interception of any API, and not just replace it but extend it – that is, it preserves the original function, and enables calling it via a so called ‘trampoline’ stub.  LeakDiag allows you to specify various low-level allocators, and once activated it intercepts them and adds stack-walking functionality to them.

To demonstrate, consider the leaking code here (adapted from a UMDH demo) :

#include “stdafx.h”
#include
#include

void LeakyFunc1();
void LeakyFunc2();
void LeakyFunc3();
void LeakHere(int value);

int _tmain(int argc, _TCHAR* argv[])
{
printf(“Activate LeakDiag tracking here…nn”);
_getch();
printf(“Take first log now…nn”);
_getch();

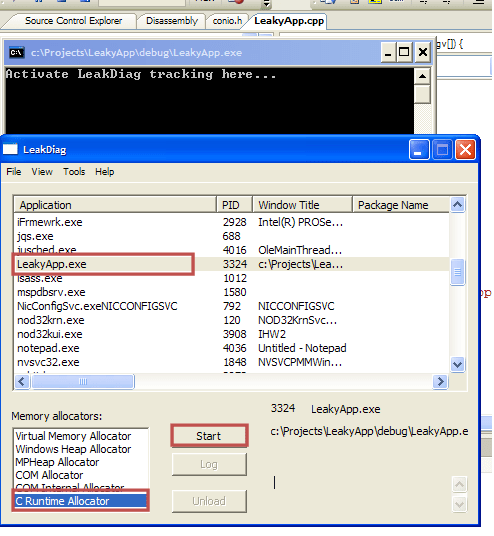
for (int i=0;i<1000;i++) { LeakyFunc1(); LeakyFunc2(); LeakyFunc3(); } printf("Take second log..nnPress any key to exit application...n"); _getch(); return 0; } void LeakyFunc1() { LeakHere(500); } void LeakyFunc2() { LeakHere(1000); } void LeakyFunc3() { LeakHere(1500); } void LeakHere(int value) { char * cBuff = new char[value]; } [/sourcecode] Start LeakDiag and run your program.  In the LeakDiag window select view/Refresh (just a good habit, meaningful if it was already running), and select your process at the list (in this example:  LeakyApp.exe).  At the first wait for input (and generally, as early as you can in the program), start the LeakDiag C Runtime allocator:

leakdiag11

This activates the API interception in your selected process (LeakyApp.exe), for your selected API (CRT allocator).

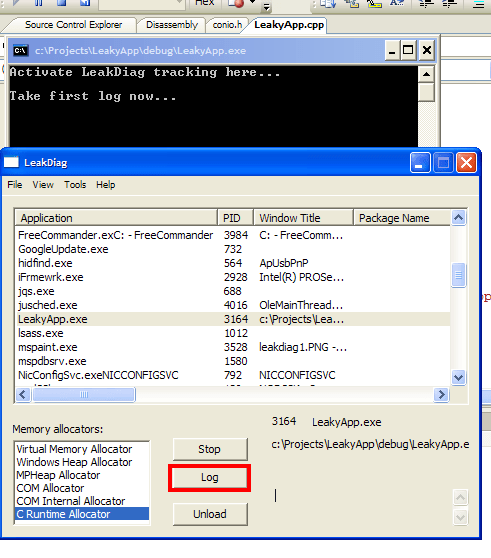
Focus back to LeakyApp.exe and press any key.  At the second and third waits for input, take a LeakDiag log:leakdiag2

Click anything again to end the program. LeakDiag dumps his logs as xml files, by default into %LeakDiag dir%/logs.  The files are quite readable and it is occasionally useful to manually dig in – but to gain some insight into large dumps (or many dumps), LDGrapher can help tremendously.

Start LDGrapher.  Open all the allocation logs you dumped. A multi-line graph would appear, where every line represents a specific recurring allocation stack. The stack responsible for most allocations is coloured red, the rest are yellow. Each x-tick is a specific log dumped.  And the useful part: click any circle, representing an allocation stack at a specific log, and inspect the complete stack leading to that allocation, along with source file names and line numbers!

leakdiag3

While this is mega-cool as is, it can be further tweaked in many ways. You can intercept and dump different allocators. If you’re hunting for a leak of a known size, you can limit the dump to include just that size (or a size range). You can use DbgHlp StackWalk to overcome FPO (which you shouldn’t use in your own code anyway!), and some more.

However,  LeakDiag has one significant flaw – that I think amounts to just a weird design choice (that is, I can’t understand when it would be helpful): all its functionality (except the GUI) seems to run in the target process. You can actually see LeakDiag messages in your debugger.

That can make delicate control quite hard. For one, you cannot place breakpoints in locations where you want a dump. (hence,the ‘getch’ in the code sample).  For two, suppose you’re not continuously leaking memory – but just forgot to release some. Wouldn’t it be nice to be able to take an allocation dump just before the process terminates, and see whatever still needs releasing?  Alas, you cannot do this with LeakDiag, as any code you intend to run immediately before terminating would not run.

The solution (hint, UMDH), would have to wait for another post.

Posted in Debugging | 12 Comments

Stepping Over Unwanted Functions

There’s an undocumented VS setting that lets you specify functions that would not be stepped into when you click F11.  This can be save quite a few clicks in situations of the form –

InterestingFunct(BoringFunc1(), BoringFunc2(),...,BoringFunc99);

Where pressing F11 would repeatedly step you into constructors, accessors, SmartPointer management routines, overloaded operators, you name it.

Now, it used to be that to achieve that you used the [ExecutionControl] section in autoexp.dat, and seems it is widely believed to still hold. However, since 2003(!) the home of these setting is the registry. Since VS2005, it’s the key-

HKLM\Software\Microsoft\VisualStudio\8.0\NativeDE\StepOver

Andy Pennell tells the full story, along with syntax (which I won’t rehash),  examples and some history – all in all, a great read.

Posted in Debugging, VC++, Visual Studio | Leave a comment

Debugging a Process Launch

While this is hardly a hidden setting, I found myself spending too much time to find it twice already – the msdn page describing it appears low on search results, since it uses very different terminology.  So,  if only for self reference, there goes:

You can easily debug executables without source (or even symbols) in VS – just attach to the running process. You can then step through instructions and watch memory and registers as you would in regular debugging.  However, I had some process-launch issues, with a process I didn’t have the source to – so I had no running process to attach to..

Apparently you cannot launch a source-less process from within VS. The way to go is to modify a registry setting that would cause windows to launch a chosen debugger (VS for me) whenever you try and execute your destination process.

The registry key is –

HKLM\Software\Microsoft\Windows NT\currentversion\image file execution options

Add a subkey with the name of the executable to debug (e.g., notepad.exe), and give it a string value with name ‘Debugger’ and either of the values –

(1) ‘vsjitdebugger.exe’ if you want the JIT debugger-selection dialog,

(2) ‘devenv /debugexe’ if you know you’d want a new VS instance,

(3) Other debuggers of your choice – windbg, ntsd, kd, etc.   Personally, I’ve yet to encounter a situation where they’re necessary, but these do exist.

The ‘image file execution options’ key contains some more goodies, that Junfeng Zhang took the time to look up and semi-document.

Edit (1) : Gregg Miskelly elaborates on Junfengs post, then updates to VS2008.  You’ll find tons of other posts googling for IFEO, but I consider these to be the most informed.

Edit (2):  Turns out there’s a much, much easier and less destructive way – vsjitdebugger.exe can accept a process as a command line argument!

It sits at the WINDOWS/system32 folder, and running ‘vsjitdebugger.exe notepad.exe’ will do the trick.

You can create a shortcut to vsjitdebugger with your executable as an argument for extra-convenience.

Type ‘vsjitdebugger.exe -?’ for a bit more stuff (executable arguments and attaching to a running process).

Posted in Debugging, Visual Studio | Leave a comment

Extending Error Codes – to DirectX and Beyond.

$err,hr is quite useful as is, but it only knows how to interpret built-in error codes. Happily, there is an easy way to extend it, via a section in autoexp.

All it takes is adding lines of the form –

error_code_in_decimal = the_string_you_want_displayed .

For instance, paste the following code into your autoexp.dat to decode Direct3D errors:

[hresult]
;1234=my custom error code
...
; start copying from here:
2289436696=D3DERR_WRONGTEXTUREFORMAT
2289436697=D3DERR_UNSUPPORTEDCOLOROPERATION
2289436698=D3DERR_UNSUPPORTEDCOLORARG
2289436699=D3DERR_UNSUPPORTEDALPHAOPERATION
2289436700=D3DERR_UNSUPPORTEDALPHAARG
2289436701=D3DERR_TOOMANYOPERATIONS
2289436702=D3DERR_CONFLICTINGTEXTUREFILTER
2289436703=D3DERR_UNSUPPORTEDFACTORVALUE
2289436705=D3DERR_CONFLICTINGRENDERSTATE
2289436706=D3DERR_UNSUPPORTEDTEXTUREFILTER
2289436710=D3DERR_CONFLICTINGTEXTUREPALETTE
2289436711=D3DERR_DRIVERINTERNALERROR

2289436774=D3DERR_NOTFOUND
2289436775=D3DERR_MOREDATA
2289436776=D3DERR_DEVICELOST
2289436777=D3DERR_DEVICENOTRESET
2289436778=D3DERR_NOTAVAILABLE
2289435004= D3DERR_OUTOFVIDEOMEMORY
2289436779=D3DERR_INVALIDDEVICE
2289436780=D3DERR_INVALIDCALL
2289436781=D3DERR_DRIVERINVALIDCALL
2289435164=D3DERR_WASSTILLDRAWING
141953135=D3DOK_NOAUTOGEN

2289436784=D3DERR_DEVICEREMOVED
141953141=S_NOT_RESIDENT
141953142=S_RESIDENT_IN_SHARED_MEMORY
141953143=S_PRESENT_MODE_CHANGED
141953144=S_PRESENT_OCCLUDED
2289436788=D3DERR_DEVICEHUNG
;end copy.

These were adapted from macros defined d3d9.h.  Just this week I learnt you could do the same with HRESULT codes of the CLR, and of course you could do the same for your own custom error codes.

Posted in Debugging, Visual Studio | Leave a comment

Watching Errors in Visual Studio

System and COM routines often set an error code, that can be retrieved by GetLastError.   There are several ways to decipher this code –

(1) Use the command line net helpmsg,

(2) From the VS menu, select Tools/Error Lookup and paste the code,

and by far the most useful:

(3) keep ‘$err,hr’ on your watch window!

‘$err’ is one of several pseudoregisters – a neat feature of Visual Studio that is all but undocumented. (although some nice references can by found online).  ‘hr’ is one of several format specifiers, indicating to VS that the raw hex value is to be interpreted as an HRESULT, or a windows error code.

Now off to a first cute enhancement.

Detecting the Location Where the Error is Raised

When you want to locate the code location that raises the error, your first approach might be to step through it, repeatedly bisecting it untilyou can pin-point the culprit line. Wouldn’t it be useful to be set a breakpoint exactly where the error is set?

You could try and set a breakpoint to SetLastError – and that might actually work for some non-MS COM errors, but its certainly inlined for MS internal components.    There are better ways.

As noted in several places, disassembling GetLastError you get –

  MOV EAX,FS:[18h]
  MOV EAX,DWORD PTR [EAX+34h]
  RET

Turns out FS:[18h] points to the current thread’s environment block, and all GetLastError does is retrieve a DWORD from a fixed offset into that block. So, you could note the memory address of that DWORD, (either by disassembling or using the undocumented NtCurrentTeb) and set a data breakpoint to it, but there’s a better way still.

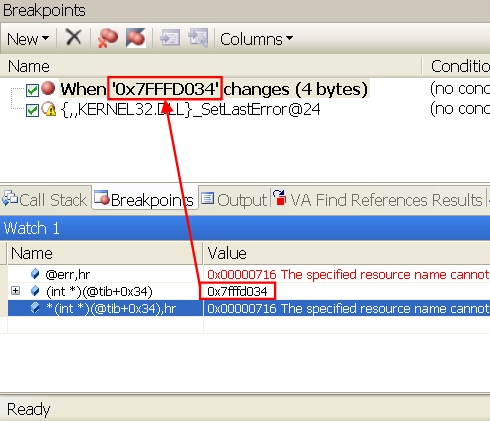
As Calvin Hsia notes, you can use another pseudoregister, $tib, just for that. The address of the error code is exactly –

@tib+0x34

Note that value and place a data breakpoint there, and you’re done!

errwatch

This breakpoint typically induces a lot of noise, as many Windows routines set expected errors and then re-set them. Its probably best to selectively enable it only around suspect code regions.

Posted in Debugging | 2 Comments

EnumDisplayMonitors Troubles – NvCpl solutions.

Recently I had EnumDisplayMonitors presenting some strange behaviour, exposing 2 monitors when in fact only one was connected. The nVidia Control panel API eventually came to the rescue – it exposes the entire functionality available via the nVidia control panel, and implemented in NvCpl.dll in the Windows\system32 folder. Specifically NvCplRefreshConnectedDevices(), quote from the manual, ‘refreshes the connection state cache for all display outputs on the selected GPU’. Never heard of the ‘connection state cache’ – indeed, by the documentation another API (NvCplGetActiveDevicesString), retrieves the ‘connected device state that was cached by the driver during such system events as bootup, logon, or opening of the display properties control panel’. Bottom line, the following code solved the problem:

typedef BOOL (APIENTRY *NvRefreshProc)( IN DWORD );

VOID RefreshDisplayCache()
{
   HANDLE hNvCpl = LoadLibrary(_T("NvCpl"));

   // The graphics driver caches monitors setup, and sometimes gets out of sync.
   // Here we force a refresh.
   if (hNvCpl)
   {
      NvRefreshProc ProcRefresh = (NvRefreshProc)
            GetProcAddress(hNvCpl, "NvCplRefreshConnectedDevices");

      if (ProcRefresh)
            (ProcRefresh) (1);  // input flag - NVREFRESH_NONINTRUSIVE
   }
}

As an added bonus, I’m now able to programmatically set ‘fixed aspect-ratio scaling’, which I couldn’t until now.


typedef DWORD (APIENTRY *dtcfgexPROC)( LPSTR );

...

// change display to fixed aspect-ratio scaling, so as not to distort the
	// picture on wide screens.
	if (hNvCpl)
	{
		dtcfgexPROC ProcAdd = (dtcfgexPROC) GetProcAddress(m_hNvCpl, "dtcfgex");

		if (ProcAdd)
			(ProcAdd) ("setscaling 1 5"); // set scaling on display #1 to mode 5 (fixed aspect ratio)
	}

(check out dtcfgex in the manual for details.) The API contains lots of other low level goodies. If you make extensive use of it, you might prefer to statically link against NvCpl.dll and include the header NvCpl.h (contained in this nVidia sample download). I have no idea how to achieve both tasks on ATI cards (and whether similar cache or scaling mode even exists there) but we ship only nVidia’s – so no worries there, for now.

Posted in Win32 | Leave a comment

Movies Trouble in PowerPoint

(Note: most of this post avoids developer jargon, in hope of being useful to all users)

Did you ever give a media-rich presentation, and had to sheepishly apologize to the audience when some movies just wouldn’t play?    Did you ever mail a presentation that the recipient was unable to play?
I once made a spectacular product PowerPoint presentation that no costumer ever saw, since none of the sales persons were able to play it. I still attend an embarrassing amount of presentations that fail to present their media properly.    The common maven answer is ‘it must be a missing codec’ but, as usual, the full story runs much deeper.

The following investigation applies to PowerPoint 2003 over Windows XP – but  from reading around I get the impression that the same issues and solutions apply to PowerPoint 2007, either over Vista or XP.

First – make sure your movie plays under Windows Media Player!  If it doesn’t – its probably indeed a codec issue. Download a codec pack and be done with it.   There are also tools that can pinpoint a missing or corrupt codec – but this post is about PowerPoint, so let’s assume the movie plays fine outside it.

Second – try to run the movie in Media Player (confusingly enough and despite the windows title, this is not Windows media player):  in the start\run prompt type mplayer2, then browse to your movie.  If you have Vista skip this test, as you don’t have that player.

Unlike some say, strictly speaking PowerPoint does not use media player – but rather both use the same mechanism, MCI (more below).   So – no luck with Media Player?  Good. Read on.

Cookbook solution

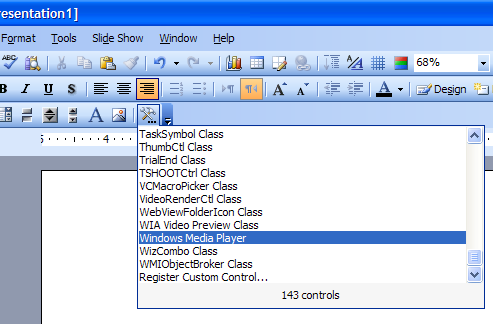
Here’s a visual rehash of the instructions for PowerPoint 2003 (the link contains instructions for PowerPoint 2007 too) on how to embed a Windows Media Player control, that would play your movie.

1. Under ‘View/Toolbars’, check ‘Control toolbox’.
2. In the new toolbar click ‘More Controls’, scroll down to pick ‘Window Media Player’, then click-n-drag to mark the movie rectangle on the slide.ppt1
3. make sure the new object is selected, then click ‘Properties’ (available via right click too).
4. Click the ellipsis to the right of ‘Custom’. Browse to the movie of your choice. To reproduce the appearance of a simple movie, in the ‘Select a mode’ combo – select ‘None’. (you might, however, find the newfound alternatives useful – check them out). ppt2
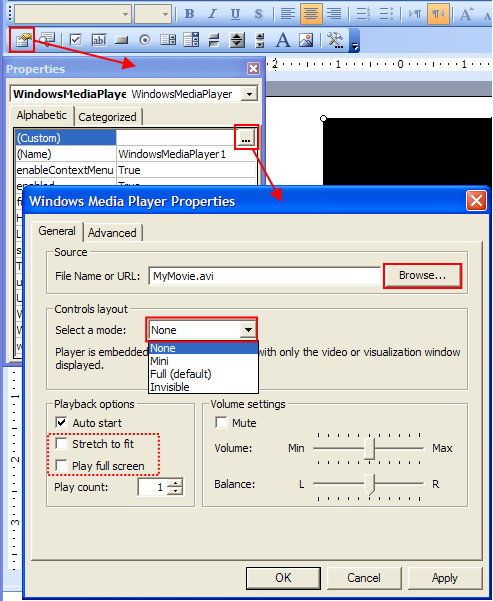
Run the slide – your movie should at least play now.
If you checked ‘Stretch to fit’ or ‘Play full screen’, you may discover that either they had no effect, or were unsaved and have no effect in the next run.    This is in fact a known WMP control bug – that remains unsolved since (at least ..) that 2004 post from Microsoft.  A workaround is in order.
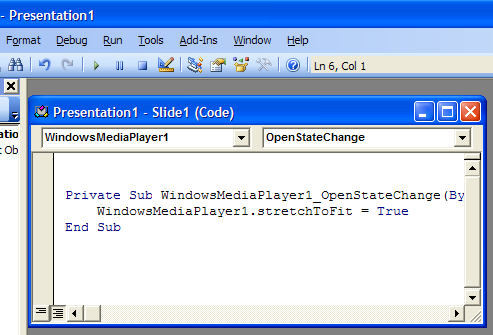
5. Double click the WMP object, and a VBA window would open. Don’t be alarmed if its unfamiliar – all you have to do is paste the following code:

Private Sub WindowsMediaPlayer1_OpenStateChange(ByVal NewState As Long)
      WindowsMediaPlayer1.stretchToFit = True
End Sub
ppt3

When trying a similar trick with ‘fullScreen’ property instead of ‘stretchToFit’, I get a run-time error – probably another WMP ActiveX bug.  Oh well, you can easily stretch the movie area to a full slide in the first place.

Under the hood

(Note: switching back to developer lingo)
The support article did say that ‘Some media clips that were created after PowerPoint was released may not play properly’. But even support can say more: ‘PowerPoint does not allow you to insert certain types of movie files directly if there are no available Media Control Interface (MCI) extensions for that type of movie.’  (which, strictly speaking, is wrong – I wish PowerPoint would complain when inserting the movie and not just play a blank).

Huh? Media control what?

Apparently, it’s an MS API – a predecessor to DirectShow that’s not technically deprecated (heck, PowerPoint uses it), but even wikipedia describes it as ‘aging’.   It uses two registry keys: ‘HKLM\SOFTWARE\Microsoft\Windows NT\CurrentVersion\MCI Extensions’  maps file extensions to abstract MCI-devices, and HKLM\SOFTWARE\Microsoft\Windows NT\CurrentVersion\MCI32 maps the devices to concrete driver dll’s.    So a ‘missing MCI extension’ means that in the MCI Extensions key, the ‘avi’ value (e.g.) is either missing or does not hold the string ‘avivideo’ as it should.
Austin Myers, PowerPoint MVP and maker of the PlaysForCertain add-in, gives an excellent summary of related newsgroup discussions.  turns out quite a few rogue media players – notably some versions of QuickTime, Xing, Real Player and WinAmp – used to modify these registry keys.  If any of these messed up during install or uninstall,  your machine remained with dysfunctional MCI registry keys!
Which brings us to an –

Alternative fix

You can try and fix MCI issues by modifying these keys (usual registry disclaimers applies: back it up, know what you are doing, yada yada). For reference, here are two excerpts from my own registry:

[HKLM\SOFTWARE\Microsoft\Windows NT\CurrentVersion\MCI Extensions]
     "avi"="avivideo"
     "mpg"="MPEGVideo"

[HKLM\SOFTWARE\Microsoft\Windows NT\CurrentVersion\MCI32]
     "AVIVideo"="mciavi32.dll"
     "MPEGVideo"="mciqtz32.dll"

Check out both Myers’ article and this 2003 WINE patch for full configurations on other machines – just act judiciously, as these configurations may greatly vary.

So, which solution is better?

The real game here is to get a ppt to play its movies not only on your machine, but on any machine – whether if you send it by mail, place it somewhere public or carry it around on a USB stick.  In fact, the previously mentioned PlaysForCertain commercial add-in tries to achieve just that by converting linked movies into a format and codec that are as common as they can possibly be.
While I have practically never seen a windows machine without WMP (never mind why), I came across a good few machines with messed up MCI settings.  So, excluding commercial solutions, I whole heartily believe your best bet would be to stick with the WMP-control solution.

Do tell me if it worked for you, and (more importantly) if not!

Posted in MS Office | Tagged , | 16 Comments

2D Matrix Watch – Introducing autoexp.dat

Deep inside your VS installation (%VS installation%\Common7\Packages\Debugger), hides a bag of goodies called autoexp.dat.
It is only semi-official, and almost entirely undocumented. Andy Pennell confesses its his fault,  but I suspect there’s more to it.  Admittedly, its still (as of VS2008) fragile, can easily crash the IDE, subject to the dreaded ‘syntax may change’ disclaimer, and generally half baked.   All that being said, its probably the best productivity-enhancer I came across in the Visual Studio universe.

Lacking official documentation, Avery – creator of the VirtualDub video editor/converter – did a spectacular  job of reverse-engineering it (1, 2) .

autoexp’s prominent feature is customization of native variables watch, both as tooltip and in watch windows. Ever wondered how STL containers are wired to the IDE?    How come STL vectors show their contents automatically, but native arrays require manual work?

vec21

Wonder no more – the wiring is done by autoexp. If that sounds even remotely useful to you, go read Avery’s posts now.  You’ll never watch arrays, lists or hash tables the same way again.

now off to a first tweak using autoexp.

Suppose you have a Direct3D-like matrix type:

struct MATRIX
{
	float        _11, _12, _13, _14;
	float        _21, _22, _23, _24;
	float        _31, _32, _33, _34;
	float        _41, _42, _43, _44;
};

and the IDE isn’t doing a very good job of helping you grok its contents:

matwatch11

Fear not!  Declare a MatrixLine type, then re-declare the matrix as a union with an array of MatrixLines:

struct MatrixLine
{float f1, f2, f3, f4; };

struct MATRIX
{
 union
 {
 struct
 {
 float        _11, _12, _13, _14;
 float        _21, _22, _23, _24;
 float        _31, _32, _33, _34;
 float        _41, _42, _43, _44;
 };
 MatrixLine line[4]; // facilitates 2d matrix visualizer in autoexp.dat
 };
};

In autoexp.dat,  under the [Visualizer] section – define a preview for each MatrixLine, and set the Matrix watch to show its MatrixLines:

MatrixLine{
	preview(#([$c.f1,f],", ",[$c.f2,f],", ",[$c.f3,f],", ",[$c.f4,f]))
	children([$c,!])
}

MATRIX{
	preview([$e,!])
	children(
            #array (
                expr: $e.line[$i],
                size: 4
					)
			)
}

and enjoy your shiny new matrix watch!

matwatch21

Posted in Debugging, Visual Studio | 4 Comments

Resolving linker warning LNK4221

While cleaning up code warnings I came across LNK4221: “xxx.obj: no public symbols found; archive member will be inaccessible.”. The message does point out the culprit obj file, but not much more. both the documentation and a knowledge base article don’t shed much additional light.  Generally, it seems i’m not the only one who couldn’t readily identify the problem source.  although useful discussions do exist, they’re hidden deep below other search results –  so I figured the issue is worth a post.

‘Public symbols’ basically means stuff that the linker can use: functions that can be called, classes that can be instantiated or variables to referenced.   (note, we mean compiled functions or classes, as the linker doesn’t  do compilation). So far I came across two scenarios that result in compilation units lacking any of those:

(1) A template-only file, typically a header file (since VC++ does not conform to the standard regarding the export keyword).    Maybe a class-wizard created a stub cpp for you, or maybe – out of habit – you did it yourself, but there’s really nothing to compile here. All you want is the header to be included wherever the templates are used – the right solution is to discard the cpp altogether.

(2) A cpp that contains real stuff, but one that is compiled only in certain configurations – e.g. debugging facilities, surrounded by #ifdef _DEBUG’s.    Can’t say I have an elegant solution for this one – if you’re obliged to zero-warning compilation, you can add to the file a dummy variable (or other symbol) that’s not conditionally compiled.  While it may add some miliseconds to link time, rest assured it would be optimized away and have zero effect in production builds.

Posted in VC++ | Tagged | 2 Comments